4.9 KiB
Examples for backend: winston
- Supported arguments:
annotation,color,color_palette,fillrange,fillcolor,group,label,legend,linestyle,linetype,linewidth,markershape,markercolor,markersize,nbins,reg,show,size,title,windowtitle,x,xlabel,xlims,y,ylabel,ylims,xscale,yscale - Supported values for axis:
:auto,:left - Supported values for linetype:
:none,:line,:path,:sticks,:scatter,:hist,:bar - Supported values for linestyle:
:auto,:solid,:dash,:dot,:dashdot - Supported values for marker:
:none,:auto,:rect,:ellipse,:diamond,:utriangle,:dtriangle,:cross,:xcross,:star1 - Is
subplot/subplot!supported? No
Initialize
using Plots
winston()
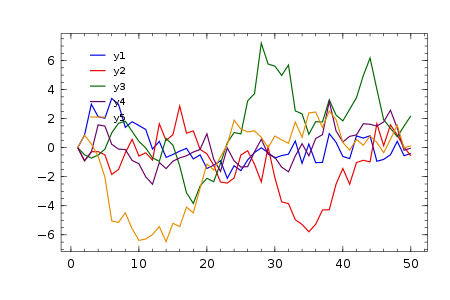
Lines
A simple line plot of the columns.
plot(fakedata(50,5),w=3)
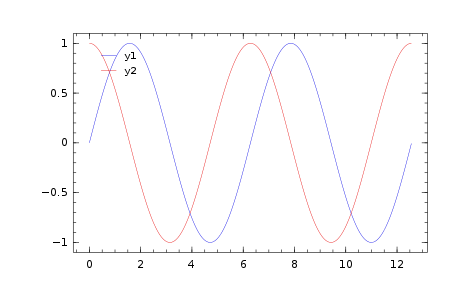
Functions
Plot multiple functions. You can also put the function first, or use the form plot(f, xmin, xmax) where f is a Function or AbstractVector{Function}.
plot(0:0.01:4π,[sin,cos])
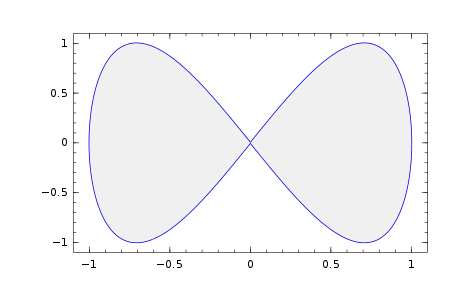
Or make a parametric plot (i.e. plot: (fx(u), fy(u))) with plot(fx, fy, umin, umax).
plot(sin,(x->begin  # /home/tom/.julia/v0.4/Plots/docs/example_generation.jl, line 39:
            sin(2x)
        end),0,2π,line=4,leg=false,fill=(0,:orange))
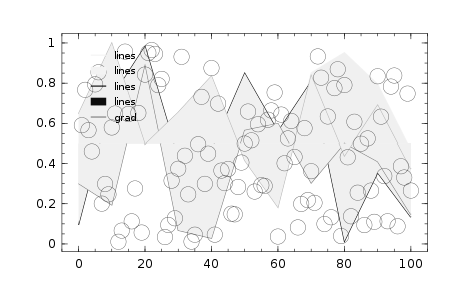
Colors
Access predefined palettes (or build your own with the colorscheme method). Line/marker colors are auto-generated from the plot's palette, unless overridden. Set the z argument to turn on series gradients.
y = rand(100)
plot(0:10:100,rand(11,4),lab="lines",w=3,palette=:grays,fill=(0.5,:auto))
scatter!(y,z=abs(y - 0.5),m=(10,:heat),lab="grad")
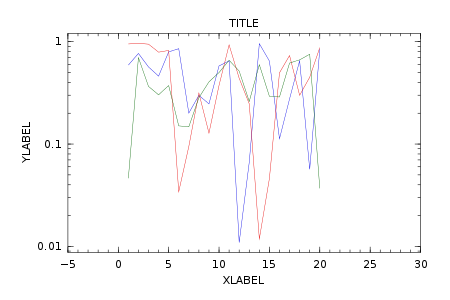
Global
Change the guides/background/limits/ticks. Convenience args xaxis and yaxis allow you to pass a tuple or value which will be mapped to the relevant args automatically. The xaxis below will be replaced with xlabel and xlims args automatically during the preprocessing step. You can also use shorthand functions: title!, xaxis!, yaxis!, xlabel!, ylabel!, xlims!, ylims!, xticks!, yticks!
plot(rand(20,3),title="TITLE",xaxis=("XLABEL",(-5,30),0:2:20,:flip),yaxis=("YLABEL",:log10),background_color=RGB(0.2,0.2,0.2),leg=false)
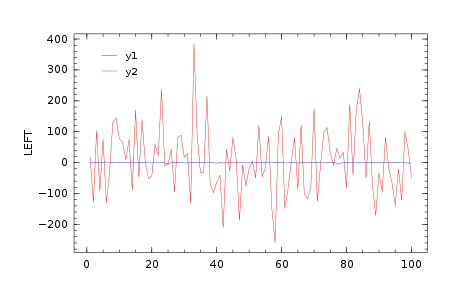
Two-axis
Use the axis arguments.
Note: Currently only supported with Qwt and PyPlot
plot(Vector[randn(100),randn(100) * 100]; axis=[:l :r],ylabel="LEFT",yrightlabel="RIGHT")
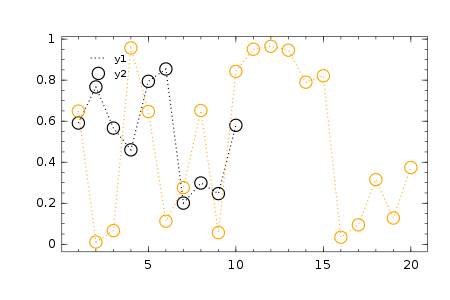
Arguments
Plot multiple series with different numbers of points. Mix arguments that apply to all series (marker/markersize) with arguments unique to each series (colors). Special arguments line, marker, and fill will automatically figure out what arguments to set (for example, we are setting the linestyle, linewidth, and color arguments with line.) Note that we pass a matrix of colors, and this applies the colors to each series.
plot(Vector[rand(10),rand(20)]; marker=(:ellipse,8),line=(:dot,3,[:black :orange]))
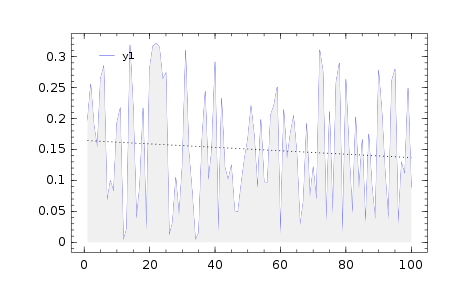
Build plot in pieces
Start with a base plot...
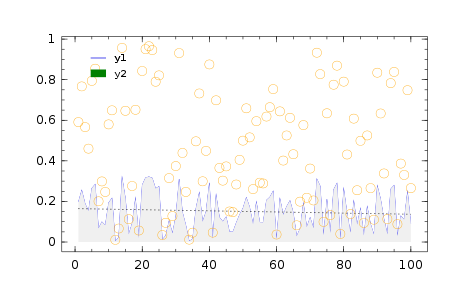
plot(rand(100) / 3,reg=true,fill=(0,:green))
and add to it later.
scatter!(rand(100),markersize=6,c=:orange)
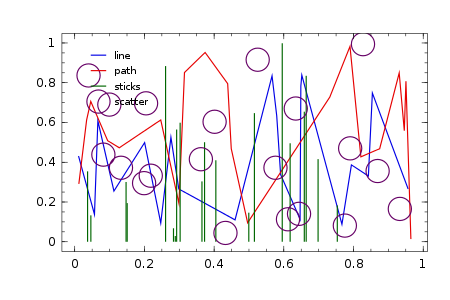
Line types
types = intersect(supportedTypes(),[:line,:path,:steppre,:steppost,:sticks,:scatter])'
n = length(types)
x = Vector[sort(rand(20)) for i = 1:n]
y = rand(20,n)
plot(x,y,line=(types,3),lab=map(string,types),ms=15)
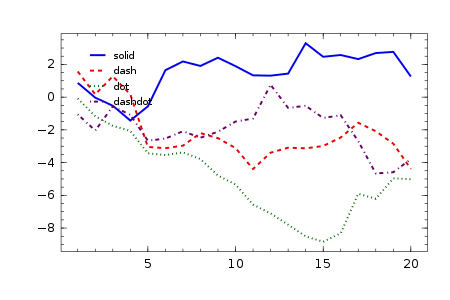
Line styles
styles = setdiff(supportedStyles(),[:auto])'
plot(cumsum(randn(20,length(styles)),1); style=:auto,label=map(string,styles),w=5)
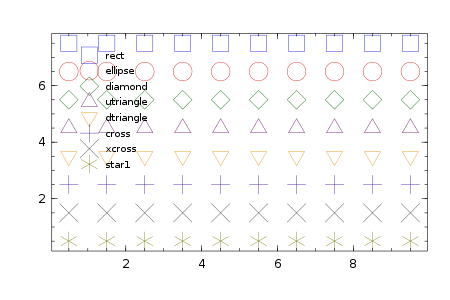
Marker types
markers = setdiff(supportedMarkers(),[:none,:auto])'
scatter(0.5:9.5,[fill(i - 0.5,10) for i = length(markers):-1:1]; marker=:auto,label=map(string,markers),ms=12)
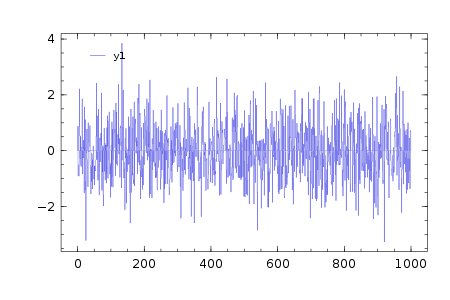
Bar
x is the midpoint of the bar. (todo: allow passing of edges instead of midpoints)
bar(randn(999))
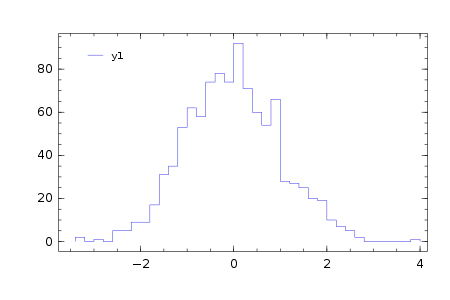
Histogram
histogram(randn(1000),nbins=50)
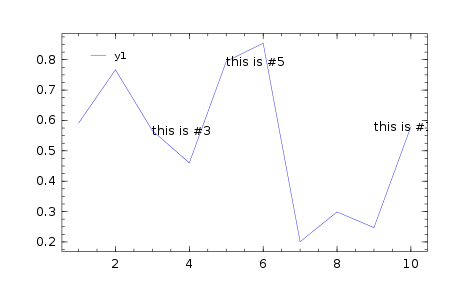
Annotations
Currently only text annotations are supported. Pass in a tuple or vector-of-tuples: (x,y,text). annotate!(ann) is shorthand for plot!(; annotation=ann)
y = rand(10)
plot(y,ann=(3,y[3],"this is #3"))
annotate!([(5,y[5],"this is #5"),(9,y[10],"this is #10")])