7.9 KiB
Plots

Plotting interface and wrapper for several plotting packages.
Please add wishlist items, bugs, or any other comments/questions to the issues list.
Examples
Installation
First, clone the package, and get any plotting packages you need:
Pkg.clone("https://github.com/tbreloff/Plots.jl.git")
Pkg.clone("https://github.com/tbreloff/Qwt.jl.git")   # [optional] requires pyqt and pyqwt
Pkg.add("Gadfly")                                     # [optional]
Use
Load it in. The underlying plotting backends are not imported until plotter() is called (which happens
on your first call to plot). This means that you don't need any backends to be installed when you call using Plots.
For now, the default backend is Qwt.
using Plots
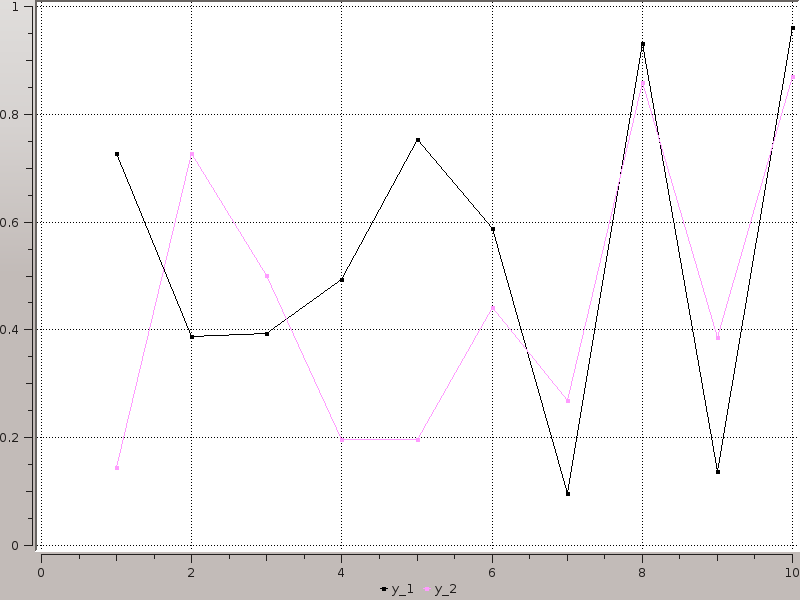
Do a plot in Qwt, then save a png:
plot(rand(10,2); marker = :rect)
savepng(ans, Plots.IMG_DIR * "qwt1.png")
which saves:
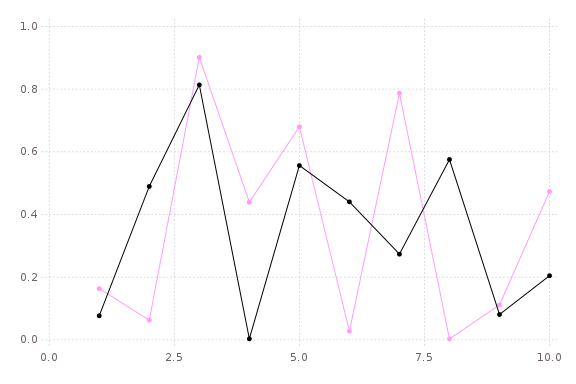
Do a plot in Gadfly, then save a png:
plotter!(:gadfly)  # switches the backend to Gadfly
plot(rand(10,2); marker = :rect)
savepng(ans, Plots.IMG_DIR * "gadfly1.png")
which saves:
plot and plotter! interface (WIP)
The main plot command. Call plotter!(:module) to set the current plotting backend.
Commands are converted into the relevant plotting commands for that package:
  plotter!(:gadfly)
  plot(1:10)    # this effectively calls `y = 1:10; Gadfly.plot(x=1:length(y), y=y)`
  plotter!(:qwt)
  plot(1:10)    # this effectively calls `Qwt.plot(1:10)`
Use plot to create a new plot object, and plot! to add to an existing one:
  plot(args...; kw...)                  # creates a new plot window, and sets it to be the `currentPlot`
  plot!(args...; kw...)                 # adds to the `currentPlot`
  plot!(plotobj, args...; kw...)        # adds to the plot `plotobj`
Now that you know which plot object you're updating (new, current, or other), I'll leave it off for simplicity. Here are some various args to supply, and the implicit mapping (AVec == AbstractVector and AMat == AbstractMatrix):
  plot(y::AVec; kw...)                       # one line... x = 1:length(y)
  plot(x::AVec, y::AVec; kw...)              # one line (will assert length(x) == length(y))
  plot(y::AMat; kw...)                       # multiple lines (one per column of x), all sharing x = 1:size(y,1)
  plot(x::AVec, y::AMat; kw...)              # multiple lines (one per column of x), all sharing x (will assert length(x) == size(y,1))
  plot(x::AMat, y::AMat; kw...)              # multiple lines (one per column of x/y... will assert size(x) == size(y))
  plot(x::AVec, f::Function; kw...)          # one line, y = f(x)
  plot(x::AMat, f::Function; kw...)          # multiple lines, yᵢⱼ = f(xᵢⱼ)
  plot(x::AVec, fs::AVec{Function}; kw...)   # multiple lines, yᵢⱼ = fⱼ(xᵢ)
  plot(y::AVec{AVec}; kw...)                 # multiple lines, each with x = 1:length(y[i])
  plot(x::AVec, y::AVec{AVec}; kw...)        # multiple lines, will assert length(x) == length(y[i])
  plot(x::AVec{AVec}, y::AVec{AVec}; kw...)  # multiple lines, will assert length(x[i]) == length(y[i])
  plot(n::Integer; kw...)                    # n lines, all empty (for updating plots)

  # TODO: how do we handle NA values in dataframes?
  plot(df::DataFrame; kw...)                 # one line per DataFrame column, labels == names(df)
  plot(df::DataFrame, columns; kw...)        # one line per column, but on a subset of column names
[TODO] You can swap out plot for subplot. Each line will go into a separate plot. Use the layout keyword:
  y = rand(100,3)
  subplot(y; layout=(2,2), kw...)           # creates 3 lines going into 3 separate plots, laid out on a 2x2 grid (last row is filled with plot #3)
  subplot(y; layout=(1,3), kw...)           # again 3 plots, all in the same row
  subplot(y; layout=[1,[2,3]])              # pass a nested Array to fully specify the layout.  here the first plot will take up the first row,
                                            # and the others will share the second row
Shorthands:
  scatter(args...; kw...)    = plot(args...; kw...,  linetype = :none, marker = :hexagon)
  scatter!(args...; kw...)   = plot!(args...; kw..., linetype = :none, marker = :hexagon)
  bar(args...; kw...)        = plot(args...; kw...,  linetype = :bar)
  bar!(args...; kw...)       = plot!(args...; kw..., linetype = :bar)
  histogram(args...; kw...)  = plot(args...; kw...,  linetype = :hist)
  histogram!(args...; kw...) = plot!(args...; kw..., linetype = :hist)
  heatmap(args...; kw...)    = plot(args...; kw...,  linetype = :heatmap)
  heatmap!(args...; kw...)   = plot!(args...; kw..., linetype = :heatmap)
Some keyword arguments you can set:
  axis            # :left or :right
  color           # can be a string ("red") or a symbol (:red) or a ColorsTypes.jl Colorant (RGB(1,0,0)) or :auto (which lets the package pick)
  label           # string or symbol, applies to that line, may go in a legend
  width           # width of a line
  linetype        # :line, :step, :stepinverted, :sticks, :dots, :none, :heatmap, :hexbin, :hist, :bar
  linestyle       # :solid, :dash, :dot, :dashdot, :dashdotdot
  marker          # :none, :ellipse, :rect, :diamond, :utriangle, :dtriangle, :cross, :xcross, :star1, :star2, :hexagon
  markercolor     # same choices as `color`, or :match will set the color to be the same as `color`
  markersize      # size of the marker
  nbins           # number of bins for heatmap/hexbin and histograms
  heatmap_c       # color cutoffs for Qwt heatmaps
  fillto          # fillto value for area plots
  title           # string or symbol, title of the plot
  xlabel          # string or symbol, label on the bottom (x) axis
  ylabel          # string or symbol, label on the left (y) axis
  yrightlabel     # string or symbol, label on the right (y) axis
  reg             # true or false, add a regression line for each line
  size            # (Int,Int), resize the enclosing window
  pos             # (Int,Int), move the enclosing window to this position
  windowtitle     # string or symbol, set the title of the enclosing windowtitle
  screen          # Integer, move enclosing window to this screen number (for multiscreen desktops)
  show            # true or false, show the plot (in case you don't want the window to pop up right away)
If you don't include a keyword argument, these are the defaults:
  axis = :left
  color = :auto
  label = automatically generated (y1, y2, ...., or y1 (R), y2 (R) for the right axis)
  width = 1
  linetype = :line
  linestype = :solid
  marker = :none
  markercolor = :match
  markersize = 3
  nbins = 100
  heatmap_c = (0.15, 0.5)
  fillto = nothing
  title = ""
  xlabel = ""
  ylabel = ""
  yrightlabel = ""
  reg = false
  size = (800,600)
  pos = (0,0)
  windowtitle = ""
  screen = 1
  show = true
When plotting multiple lines, you can give every line the same trait by using the singular, or add an "s" to pluralize. (yes I know it's not gramatically correct, but it's easy to use and implement)
plot(rand(100,2); colors = [:red, RGB(.5,.5,0)], axiss = [:left, :right], width = 5) # note the width=5 is applied to both lines
TODO
- Plot vectors/matrices/functions
- Plot DataFrames
- Subplots
- Histograms
- 3D plotting
- Scenes/Drawing
- Graphs
- Interactivity (GUIs)
- Gadfly.jl
- PyPlot.jl
- Winston.jl
- Gaston.jl
- GLPlot.jl
- Qwt.jl
- Bokeh.jl
- Plotly.jl
- GoogleCharts.jl
- Vega.jl
- PLplot.jl
- TextPlots.jl
- ASCIIPlots.jl
- Sparklines.jl
- UnicodePlots.jl
- Hinton.jl
- ImageTerm.jl
- GraphViz.jl
- TikzGraphs.jl
- GraphLayout.jl
Author
Thomas Breloff (@tbreloff)