851 B
851 B
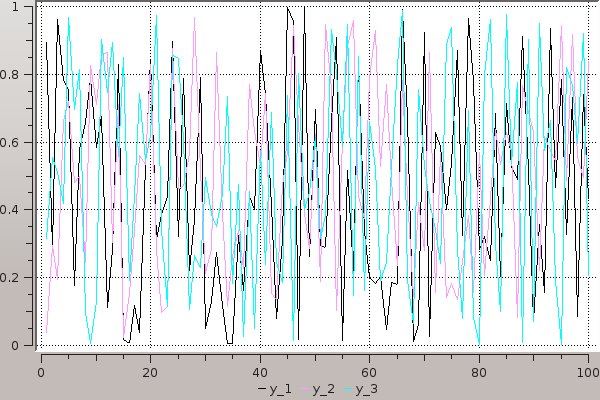
Lines
A simple line plot of the 3 columns.
plot(rand(100,3))
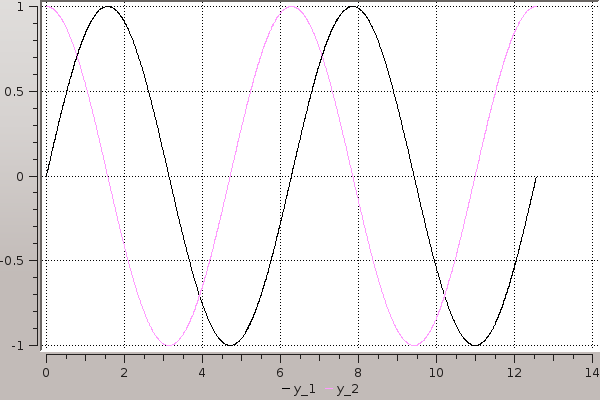
Functions
Plot multiple functions
plot(0:0.01:4π,[sin,cos])
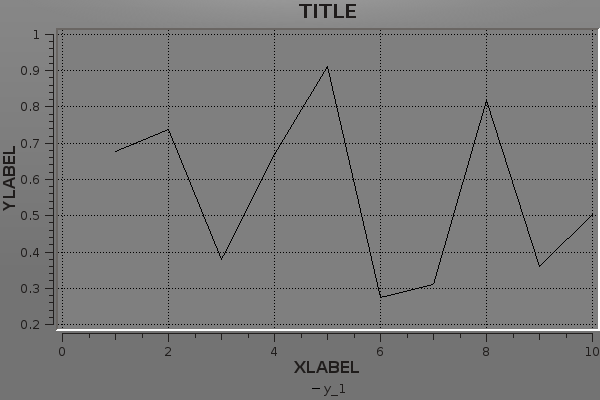
Global
Change the guides/background without a separate call.
plot(rand(10); title="TITLE",xlabel="XLABEL",ylabel="YLABEL",background_color=RGB(0.5,0.5,0.5))
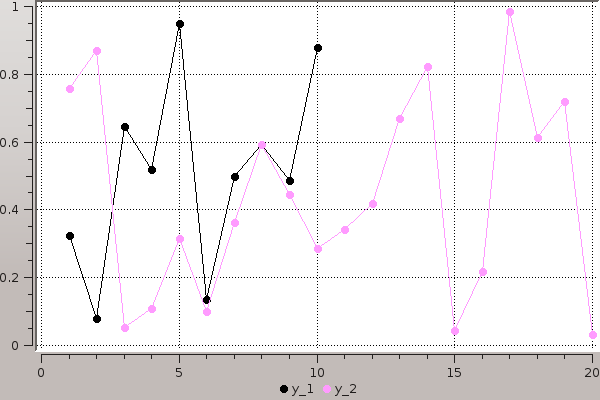
Vectors
Plot multiple series with different numbers of points.
plot(Vector[rand(10),rand(20)]; marker=:ellipse,markersize=8)
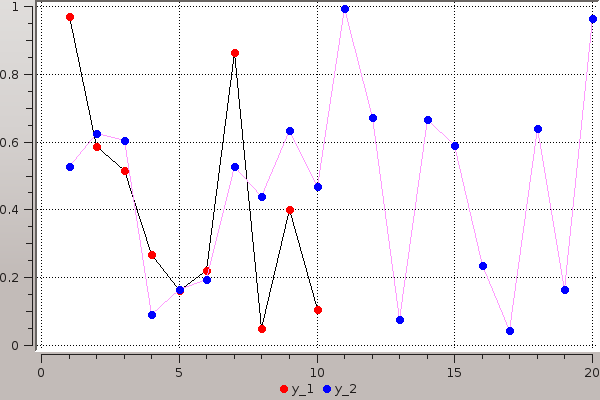
Vectors w/ pluralized args
Mix arguments that apply to all series with arguments unique to each series.
plot(Vector[rand(10),rand(20)]; marker=:ellipse,markersize=8,markercolors=[:red,:blue])