Plot recipes
A plot recipe is a quicklook visualization procedure aimed at reducing the amount of repetitive code to generate a plot. More specifically, a recipe is a function that convert data from the "Julia world" into a form suitable to be ingested in Gnuplot.jl, namely a scalar (or a vector of) Gnuplot.PlotElement object(s). The latter contain informations on how to create a plot, or a part of it, and can be used directly as arguments in a @gp or @gsp call.
There are two kinds of recipes:
explicit recipe: a function which is explicitly invoked by the user. It can have any name and accept any number of arguments and keywords. It is typically used when the visualization of a data type requires some extra information, beside data itself (e.g. to plot data from a
DataFrameobject, see Explicit recipe (example));implicit recipe: a function which is automatically called by Gnuplot.jl. It must extend the p
recipe()](@ref) function, and accept exactly one mandatory argument. It is typically used when the visualization is completely determined by the data type itself (e.g. the visualization of aMatrix{ColorTypes.RGB}object as an image, see Image recipes);
An implicit recipe is invoked whenever the data type of an argument to @gp or @gsp is not among the allowed ones (see @gp() documentation). If a suitable recipe do not exists an error is raised. On the other hand, an explicit recipe needs to be invoked by the user, and the output passed directly to @gp or @gsp.
Although recipes provides very efficient tools for data exploration, their use typically hide the details of plot generation. As a consequence they provide less flexibility than the approaches described in Basic usage and Advanced usage.
Currently, the Gnuplot.jl package provides no built-in explicit recipe. The implicit recipes are implemented in recipes.jl.
Explicit recipe (example)
To generate a plot using the data contained in a DataFrame object we need, beside the data itself, the name of the columns to use for the X and Y coordinates. The following example shows how to implement an explicit recipe to plot a DataFrame object:
using RDatasets, DataFrames, Gnuplot
import Gnuplot: PlotElement, DatasetText

function plotdf(df::DataFrame, colx::Symbol, coly::Symbol; group=nothing)
    if isnothing(group)
        return PlotElement(data=DatasetText(df[:, colx], df[:, coly]),
                           plot="w p notit",
                           xlab=string(colx), ylab=string(coly))
    end

    out = Vector{Gnuplot.PlotElement}()
    push!(out, PlotElement(;xlab=string(colx), ylab=string(coly)))
    for g in sort(unique(df[:, group]))
        i = findall(df[:, group] .== g)
        if length(i) > 0
            push!(out, PlotElement(data=DatasetText(df[i, colx], df[i, coly]),
                                   plot="w p t '$g'"))
        end
    end
    return out
end

# Load a DataFrame and convert it to a PlotElement
iris = dataset("datasets", "iris")
@gp plotdf(iris, :SepalLength, :SepalWidth, group=:Species)
[ Info: Precompiling RDatasets [ce6b1742-4840-55fa-b093-852dadbb1d8b]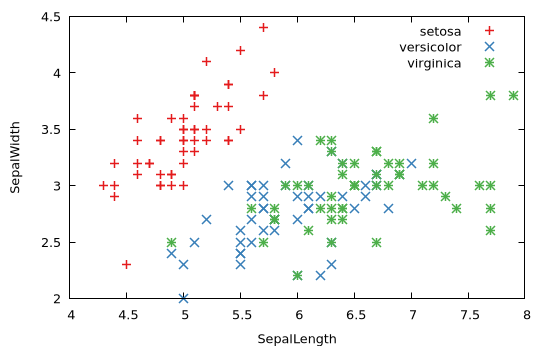
Histogram recipes
The object returned by the hist() function can be readily visualized by means of implicit recipes defined on the Gnuplot.Histogram1D and Gnuplot.Histogram2D types:
x = randn(1000);
@gp hist(x)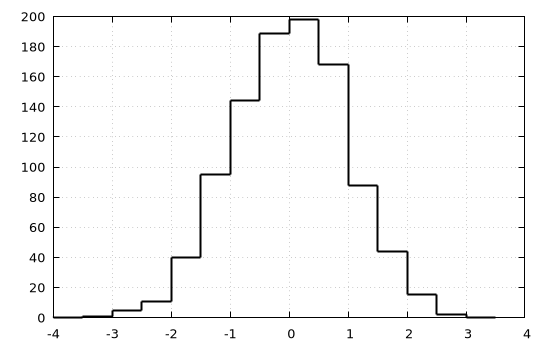
x = randn(1000);
y = randn(1000);
@gp hist(x, y)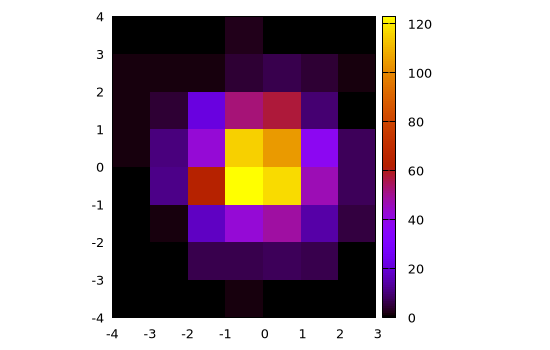
Image recipes
The Gnuplot.jl package provides implicit recipes to display images in the following formats:
Matrix{ColorTypes.RGB{T}};Matrix{ColorTypes.RGBA{T}}Matrix{ColorTypes.Gray{T}};Matrix{ColorTypes.GrayA{T}};
To use these recipes simply pass an image to @gp, e.g.:
using TestImages
img = testimage("lighthouse");
@gp img
[ Info: Precompiling TestImages [5e47fb64-e119-507b-a336-dd2b206d9990]
[ Info: Precompiling ImageMagick [6218d12a-5da1-5696-b52f-db25d2ecc6d1]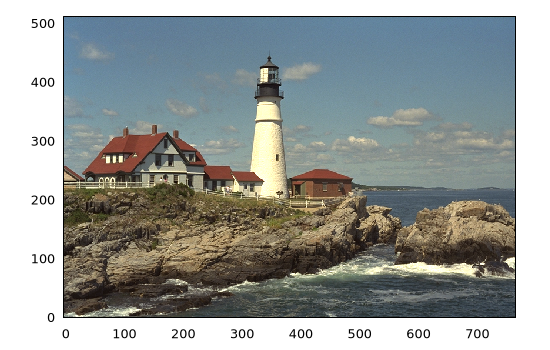
All such recipes are defined as:
function recipe(M::Matrix{ColorTypes.RGB{T}}, opt="flipy")
  ...
end
with only one mandatory argument. In order to exploit the optional keyword we can explicitly invoke the recipe as follows:
img = testimage("walkbridge");
@gp palette(:gray) recipe(img, "flipy rot=15deg")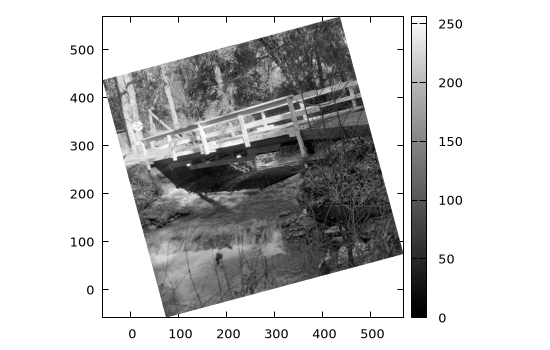
Note that we used both a palette (:gray, see Palettes and line types) and a custom rotation angle.
The flipy option is necessary for proper visualization (see discussion in Plot matrix as images).